
West Texas Intermediate shows a clear downtrend on the hourly chart as seen through the descending trendline connecting lower highs from 64.08. AS the market opened on a gap showing strong selling pressure on oil prices, we anticipate a correction to fill the gap fully or partially before continuing to trend downward.
Short term and mid-term moving averages MA (5, 10, 30) are aligned in a bearish structure with the slope and crossover.
The next major support is today’s low at around $55.53.
RSI recovered from the oversold zone and it’s currently hovering near 40 suggesting some room for further bullish correction before the downtrend continues.
As long as price stays below the descending trendline and moving average (30), the downtrend is expected to continue. A strong break and close above the trendline and the moving average (30) would signal a possible reversal to the upside.
WTI 1H Chart
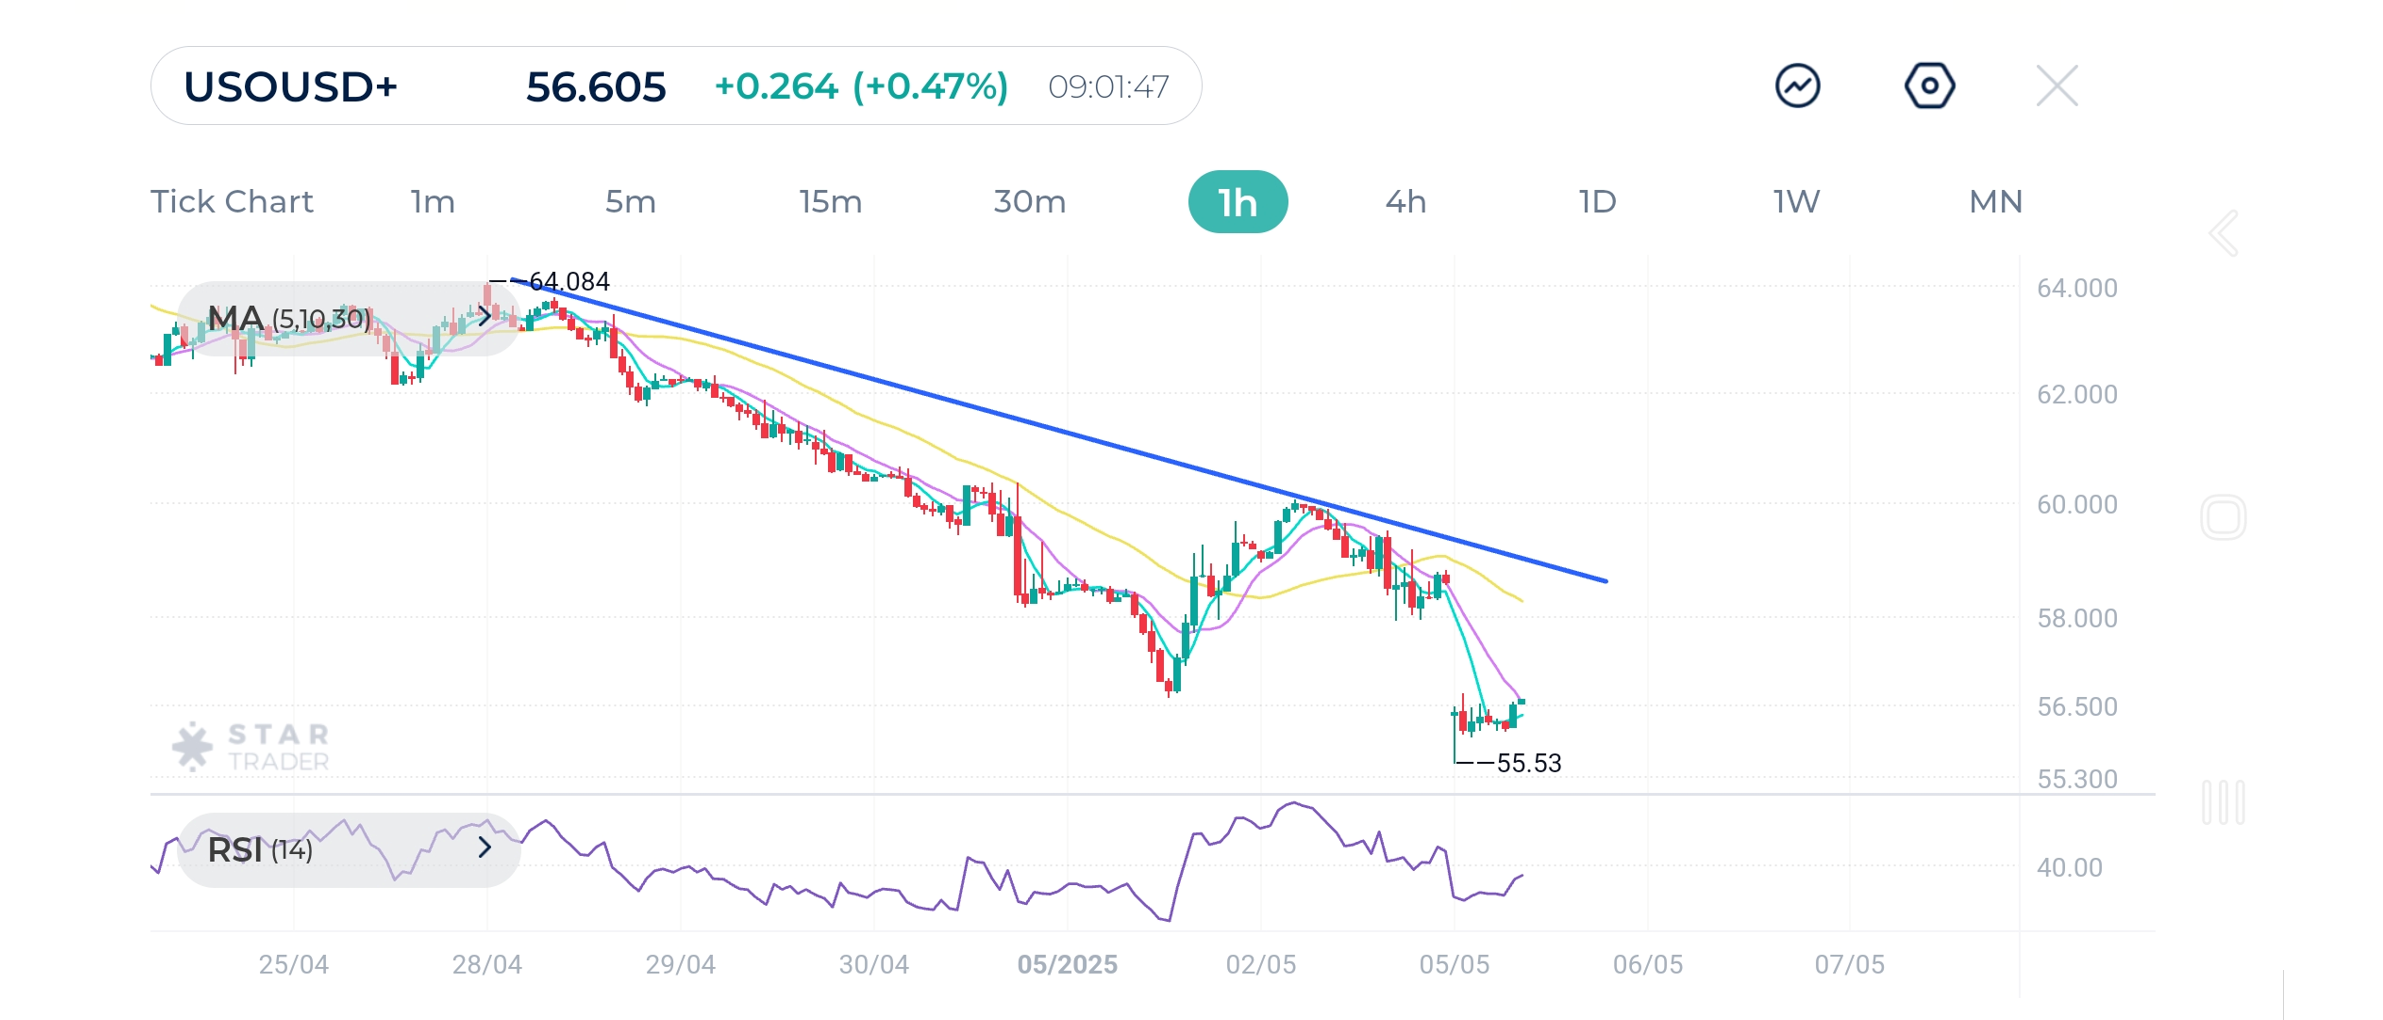
| Resistance | $56.67 | $57.44 | $58.37 |
| Support | $55.59 | $55.00 | $54.76 |
After bottoming out near 1.1265 support level, EURUSD has pushed higher following US job market numbers last week. The hourly chart shows fluctuation and indecisiveness. The moving averages MA(5) and MA(10) have recently crossed mid-term moving average MA(30) indicating bullish momentum.
Immediate resistance to watch closely is at 1.1381, the recent swing high.
RSI is moving around 55-60, showing bullish momentum without being overbought yet.
If the price remains above 1.1300 and moving average MA(30), further upside movements is expected towards 1.1380.
If price falls below 1.1300 and closes on the hourly chart below this level, expect a drop further to 1.1292
EURUSD 1H Chart
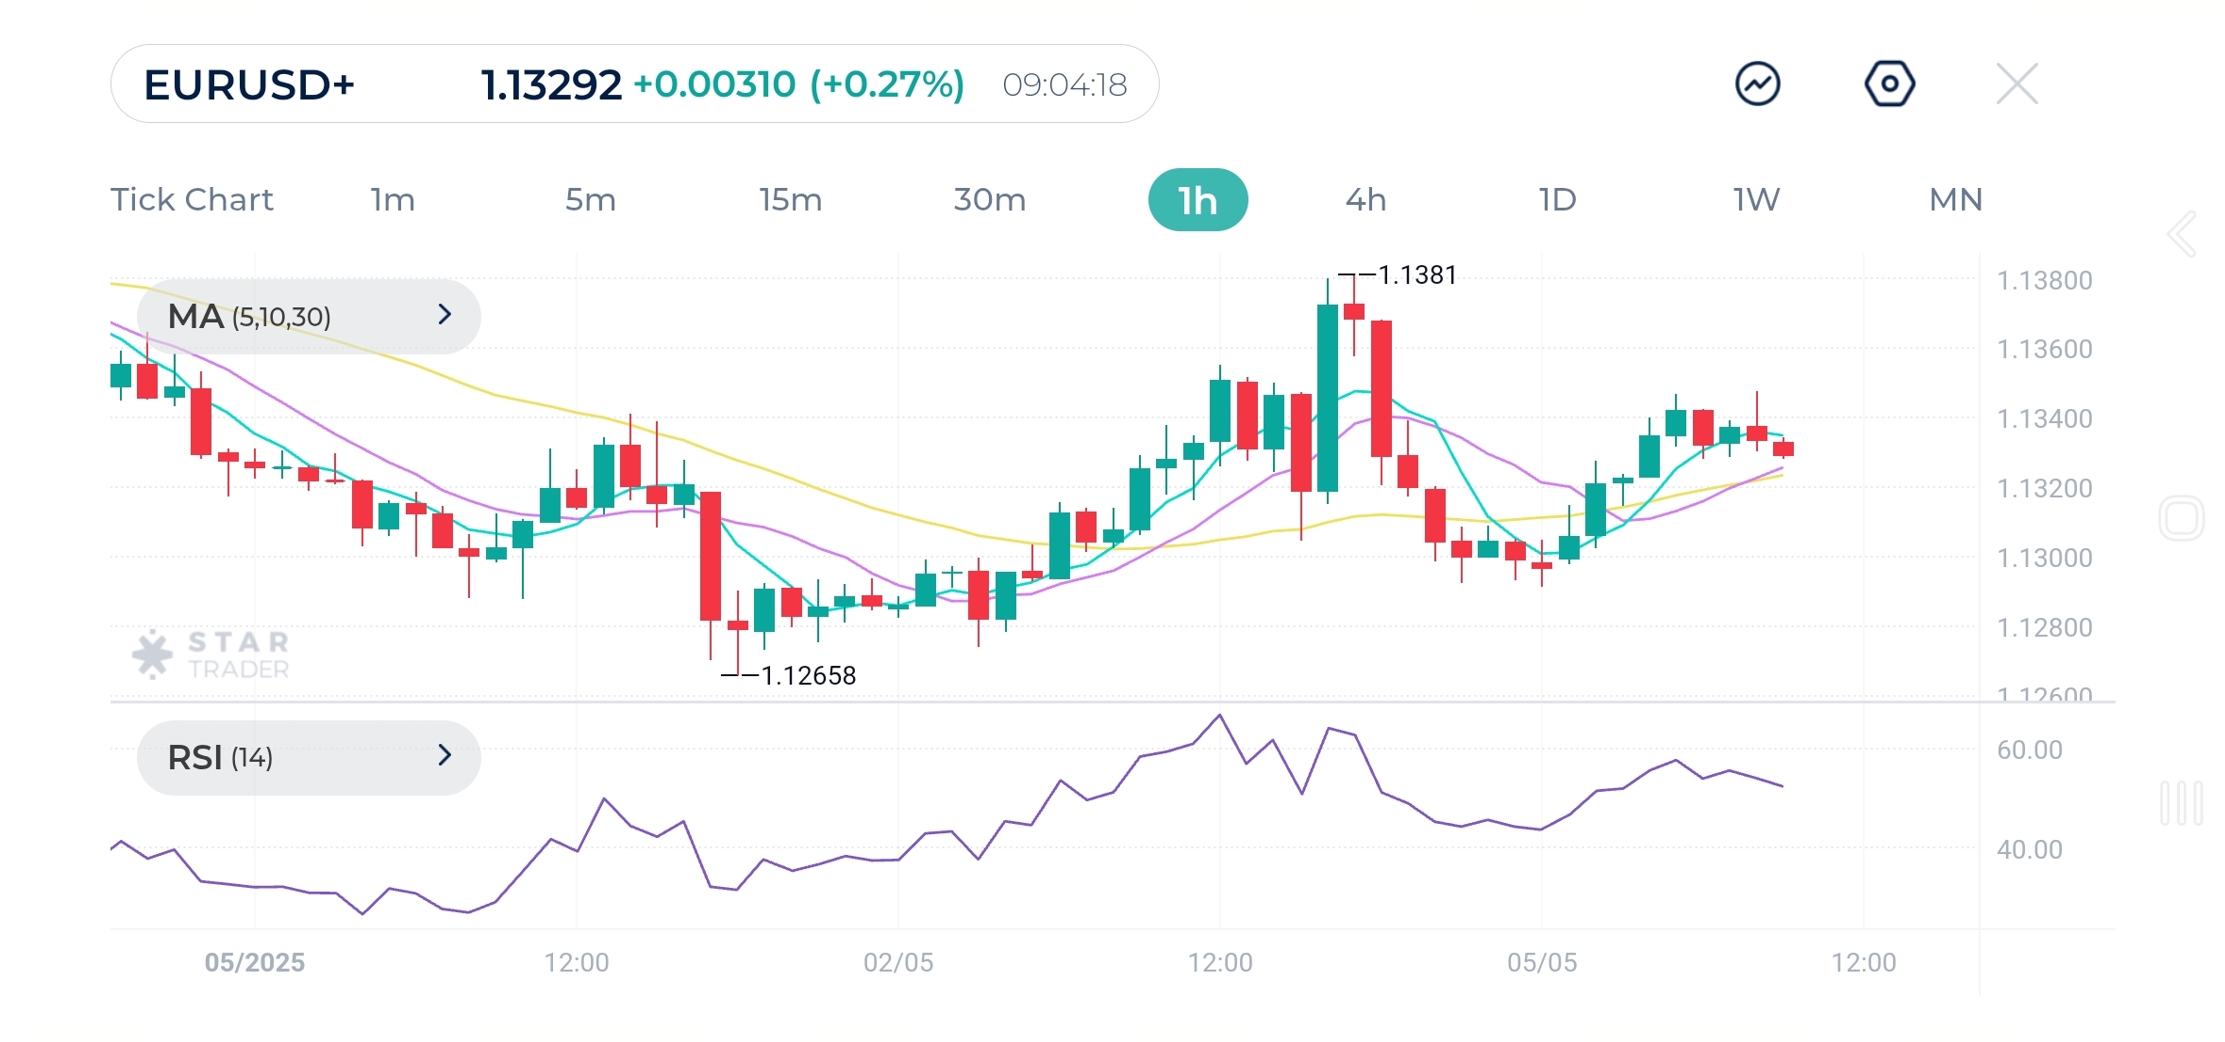
| Resistance | 1.1348 | 1.1381 | 1.1400 |
| Support | 1.1292 | 1.1274 | 1.1265 |
The USDCAD pair has been trading in a range between 1.3760 and 1.3850 since last week with no clear trend. The pair is expected to face strong support at 1.3760
RSI is around 45-50, confirming neutral momentum.
Remain on the lookout for range trading opportunities until breakout to either side.
A break above 1.3850 with 1H candle close above this level is indicative of a bullish movement toward 1.3900
On the other hand, a break below 1.3760 indicates a bearish move likely targeting 1.3700.
USDCAD 1H Chart
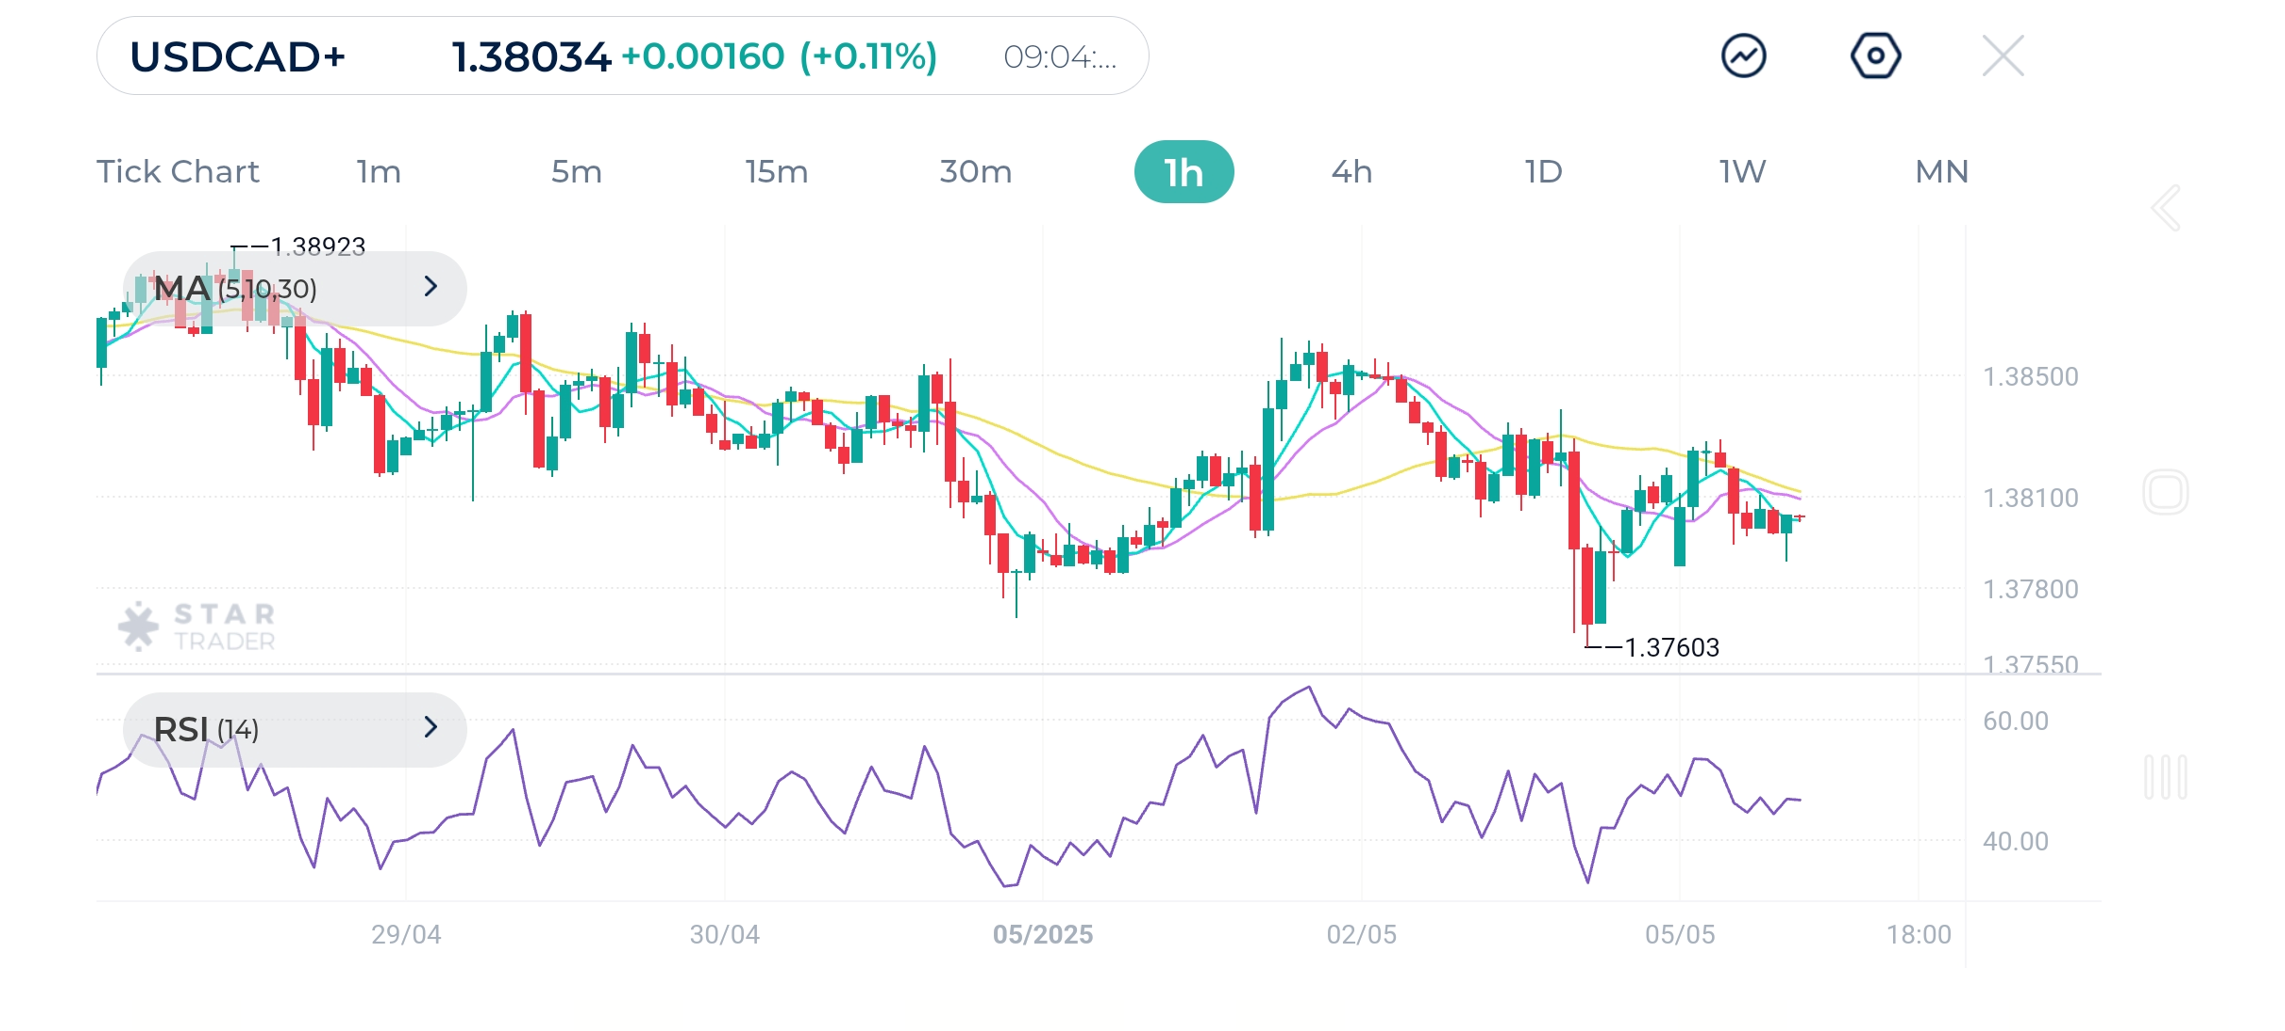
| Resistance | 1.3828 | 1.3840 | 1.3871 |
| Support | 1.3788 | 1.3760 | 1.3734 |
Tags
Open Live Account
Please enter a valid country
No results found
No results found
Please enter a valid email
Please enter a valid verification code
1. 8-16 characters + numbers (0-9) 2. blend of letters (A-Z, a-z) 3. special characters (e.g, !a#S%^&)
Please enter the correct format
Please tick the checkbox to proceed
Please tick the checkbox to proceed
Important Notice
STARTRADER does not accept any applications from Australian residents.
To comply with regulatory requirements, clicking the button will redirect you to the STARTRADER website operated by STARTRADER PRIME GLOBAL PTY LTD (ABN 65 156 005 668), an authorized Australian Financial Services Licence holder (AFSL no. 421210) regulated by the Australian Securities and Investments Commission.
CONTINUEImportant Notice for Residents of the United Arab Emirates
In alignment with local regulatory requirements, individuals residing in the United Arab Emirates are requested to proceed via our dedicated regional platform at startrader.ae, which is operated by STARTRADER Global Financial Consultation & Financial Analysis L.L.C.. This entity is licensed by the UAE Securities and Commodities Authority (SCA) under License No. 20200000241, and is authorised to introduce financial services and promote financial products in the UAE.
Please click the "Continue" button below to be redirected.
CONTINUEError! Please try again.